piegy.videos
Ths piegy.videos module is intended to reveal how some values or distribution change over time, which is hard to show in 2D figures.
Videos are made based on our figure functions, see piegy.figures.
However, not all figure functions are suited for making videos, such as peigy.figures.UV_dyna: it already reveals the population dynamics.
A list of supported functions is also in this given in videos.SUPPORTED_FIGURES.
- videos.SUPPORTED_FIGURES
- Type:
list of str
A list of valid keywords to pass topiegy.videos.make_video. Every keyword is mapped to a function ofpiegy.figuresand used to make frames.Elements:'UV_heatmap'- mapped topiegy.figures.UV_heatmap'pi_heatmap'- mapped topiegy.figures.pi_heatmap'UV_bar'- mapped topiegy.figures.UV_bar'pi_bar'- mapped topiegy.figures.pi_bar'UV_hist'- mapped topiegy.figures.UV_hist'pi_hist'- mapped topiegy.figures.pi_hist'UV_pi'- mapped topiegy.figures.UV_pi
- videos.make_video(mod, func_name='UV_heatmap', frames=100, dpi=200, fps=30, color_H='Greens', color_D='Purples', annot=False, fmt='.3g', del_frames=False, dirs='videos')
Makes video to show how some values or distribution change over time. No return value.
- Parameters:
mod (
piegy.simulation.modelobject) – where the parameters of the model and data are stored.func_name (str) – the name of figures function to use (to make frames). Valid names and corresponding functions are listed in
piegy.videos.SUPPORTED_FIGURESframes (int) – the number of frames to make. More frames generate smoother videos.
dpi (int) – dots per inch in each frame.
fps (int) – frames per second.
color_H (str) – color for U’s video. Can be either matplotlib color maps or regular colors, depending on whether you are making heatmap videos or not. If
'heatmap'is infunc_name, please use color maps. Otherwise use regular colors.color_D (str) – similar to
color_H.del_frames (bool) – whether to delete frames after videos are made.
dirs (str) – where to store the videos and frames, should be a path of a folder.
Examples
Here we provide some usage examples for the piegy.videos module.
First let’s import some necessary modules:
from piegy import simulation, videos
We will use our demo model. You can get a copy by piegy.simulation.demo_model:
mod = simulation.demo_model()
simulation.run(mod)
In this demo model, we started from a uniform population distribution and arrived at a rather clustered distribution. For example, the following are the U average distribution at start and end of simulation:
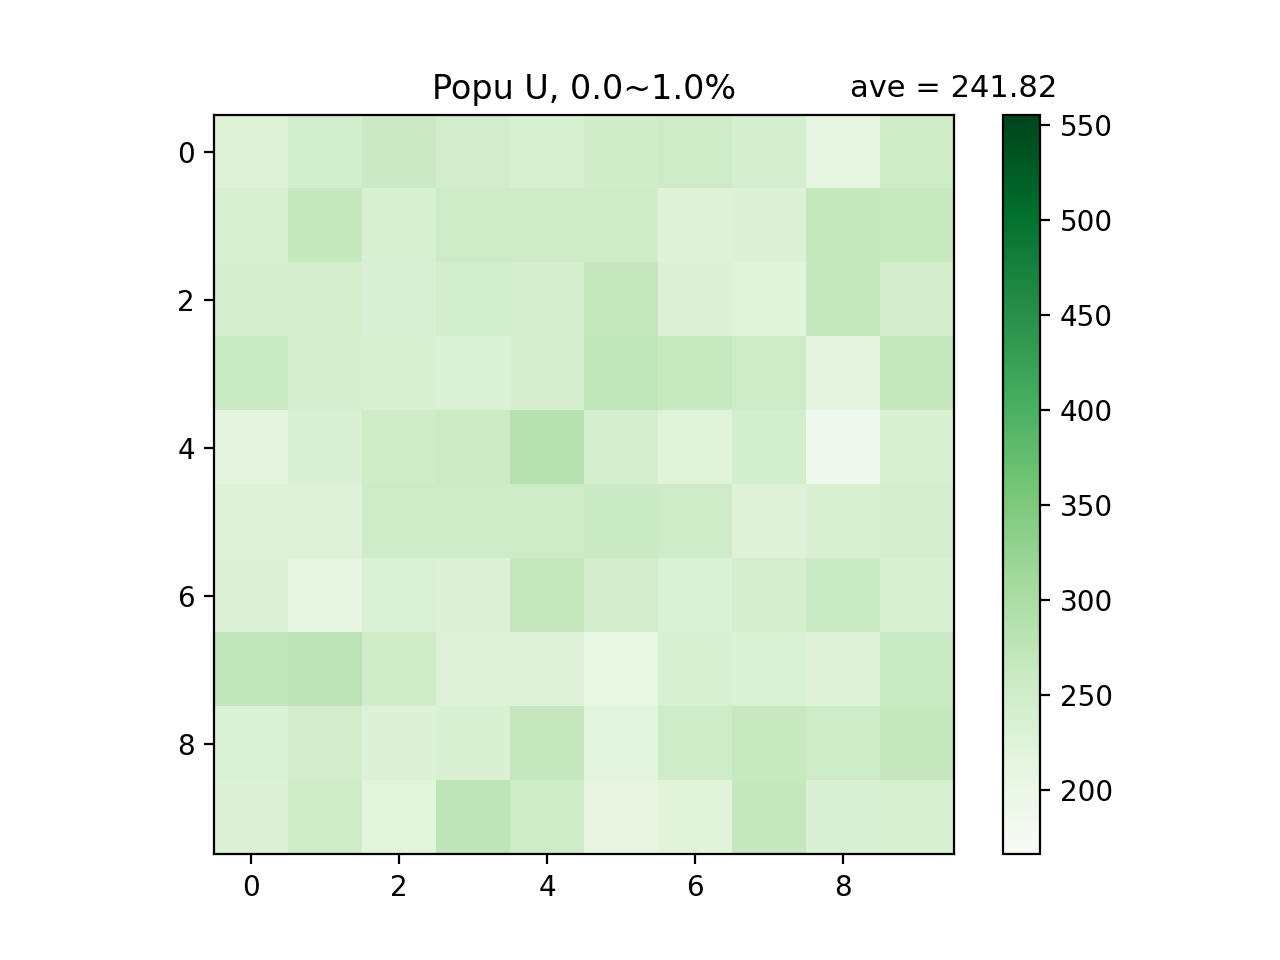
Average distribution of hawks (U) at the start of simulation, i.e., 0% ~ 1% of maxtime
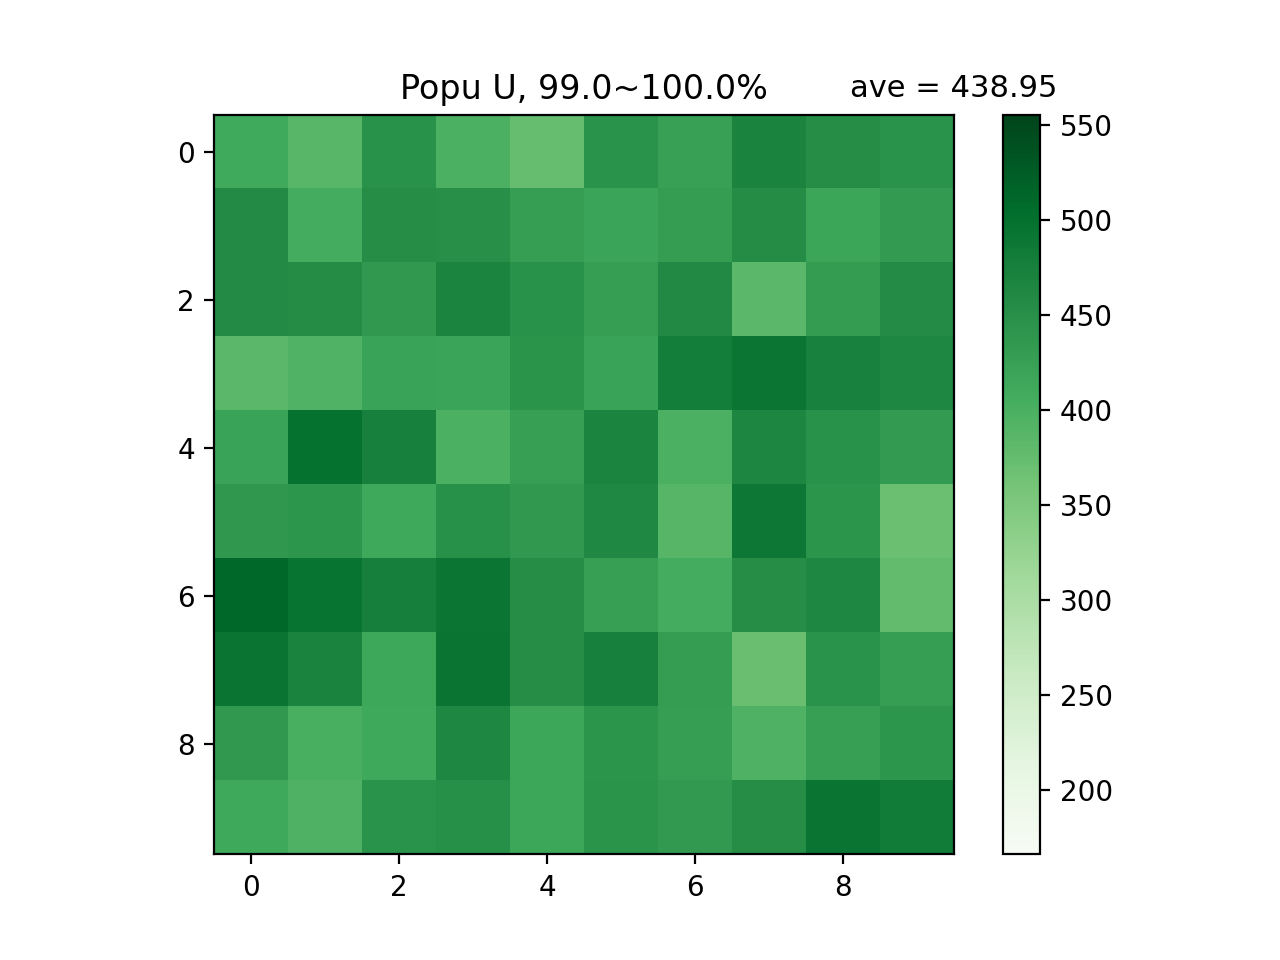
Average distribution of hawks (U) at the end of simulation, i.e., 99% ~ 100% of maxtime
We can visualize the change in between by videos. Call piegy.videos.make_video:
make_video(mod)
We make videos in a naive approach: first make frames, and then put frames together into videos.
The videos will be saved at 'videos' directory. You can specify a location using dirs parameter.
Additionally, you can also make other types of videos, such as correlation between population and payoff, by the func_name parameter.
See the make_video function description above for detailed explanation of all parameters.